Operating Claude Code, and Debugging What Breaks
Claude Code's components and modes — Rules, Skills, Commands, Agents, Memory, the CLAUDE.md and settings hierarchy, headless and streaming and auto modes — and the debugging discipline of isolating a failure between the integration layer and the model.
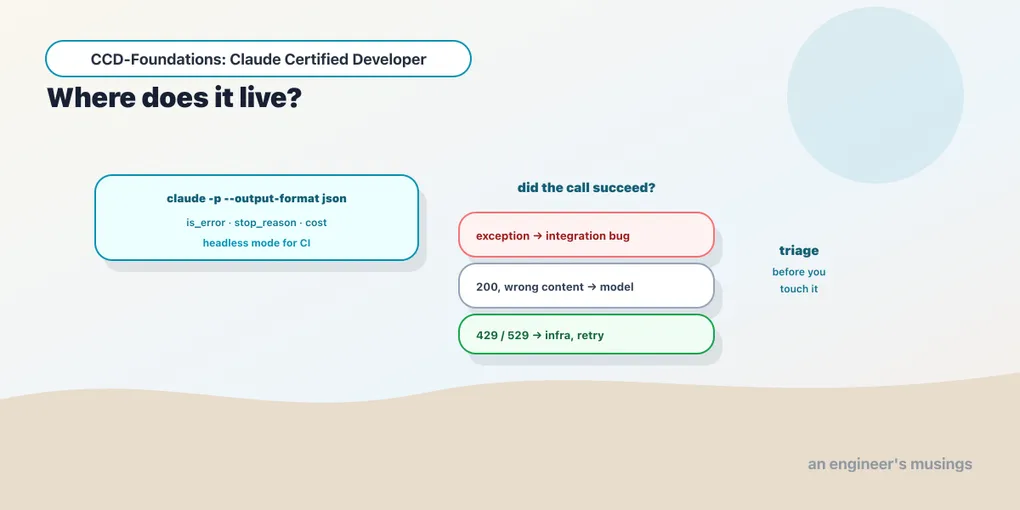
Two subjects close the arc, and they’re the ones a developer lives in day to day: Claude Code, the agent you configure and operate, and the debugging discipline that saves the most time on any Claude app. Claude Code is worth a mental model up front. It’s the agentic loop of chapter 1 wrapped in a harness you configure with files. A set of components — instructions, skills, commands, subagents — each with a defined place, run in a mode you pick to fit the task. Debugging is one disciplined question asked over and over: where does this failure live? In a system with an integration layer, a model, and infrastructure, naming which of the three broke collapses the search space. This chapter covers both. They map to two low-weighted but concrete exam domains: Claude Code (Domain 3, 3.1%) and debugging (Domain 4, 2.6%).
Claude Code’s components
Claude Code is configured through a handful of components, each with a defined place (the details were sourced authoritatively for the companion Architect book):
- CLAUDE.md: persistent instructions loaded automatically, in a hierarchy: user (
~/.claude/CLAUDE.md), project (./CLAUDE.md, team-shared), and local/personal, with longest-path / most-specific winning. - Rules: scoped instructions that apply to specific file paths, via
paths:frontmatter, so a convention loads only for the files it governs. - Skills: discovery-driven procedures (
.claude/skills/<name>/SKILL.md) the model invokes when a task matches (chapter 12). - Commands: user-driven custom slash commands (
.claude/commands/<name>.md) you invoke explicitly. - Agents: subagent definitions for delegation (chapters 7–8).
- Agent Memory: facts an agent accumulates across a project.
And settings.json configures behavior — permissions, hooks, environment, model — through a precedence chain: managed (enterprise) over command-line arguments over local (personal, gitignored) over project (team-shared) over user. Higher scope wins, except permission rules, which merge. The tested skill is knowing which file a given setting belongs in: team convention → project, personal preference → local, org policy → managed. That’s chapter 6’s configuration management, in Claude Code’s own terms. A new repo is set up with /init, which scaffolds a CLAUDE.md from the codebase.
The modes
Claude Code runs in several modes, and the exam expects you to know when each applies:
- Interactive: the default REPL you type in, with session management (resume, fork) underneath.
- Headless / non-interactive:
claude -p "<prompt>", for scripts and CI, with--output-format jsonfor machine-readable results (the CI/CD entry point). This is what runs Claude Code in a pipeline. - Streaming: output delivered incrementally (chapter 2’s lifecycle, at the CLI level).
- Auto mode: low-risk actions approved automatically while dangerous ones are still gated, for less-supervised runs.
- Plan mode: Claude proposes a plan and waits for approval before executing, for changes you want to review first.
Headless mode: claude -p "What is 2+2?" --output-format json --model haiku returned a structured result object:
{"is_error": false, "num_turns": 1, "stop_reason": "end_turn",
 "session_id": "ac0ac5c2-…", "total_cost_usd": 0.0109,
 "usage": {"input_tokens": 10, "cache_creation_input_tokens": 6574,
           "cache_read_input_tokens": 17637, "output_tokens": 73, …}}```

Two things worth carrying from that. First, the JSON gives you everything a pipeline needs: `is_error` to branch on, `stop_reason`, `session_id` to resume, `total_cost_usd`, and full `usage`. Second, a trivial "2+2" cost about **a cent** and shows **17,637 cache-read tokens**. That's because the Claude Code *harness* carries a large system prompt — its tools, instructions, context — that's cached but still billed. The lesson: the agent harness has real overhead a raw API call doesn't. That's why chapter 8's "match the abstraction to the task" matters for cost, not just complexity.

## Debugging: where does the failure live?

Domain 4 is small but it names the single most useful debugging skill: **problem origin isolation between the integration layer and the model output.** When a Claude application misbehaves, the failure is in one of three places, and naming which one collapses the search space:

1. **The integration layer**: your code built a bad request. This surfaces as an *exception*: a `400 BadRequestError` (malformed request), a `404` (wrong model id), a `413` (too large). Taxonomy in chapter 4. These are *your* bug, deterministic, and fixed in your code — no amount of prompt-tuning helps.
2. **The model output** — a *successful* call (HTTP 200) whose *content* is the problem: a wrong extraction, a hallucinated value, a `stop_reason` of `refusal`, a tool call with bad arguments. The request was fine; the output isn't. This is fixed with prompt engineering, examples, or a different model — not with error handling.
3. **The infrastructure** — a `429`, `529`, or `5xx`: capacity, not correctness. Fixed with retries and backoff (the SDK already does two).

The mistake that wastes hours is a category mix-up: treating bad output (category 2) as a broken integration (category 1), or vice versa. That's tuning prompts to fix what is actually a malformed request, or adding error handling for what is actually a bad extraction. **First ask: did the call succeed?** A raised exception points at the integration or infrastructure; a 200 with wrong content points at the model. That one question routes the whole investigation.

## Trace analysis

The other debugging skill is **trace analysis** — reading what actually happened. For an agent, that means the sequence of turns: which tools were called, with what arguments, what results came back, and where the `stop_reason` went sideways. The headless JSON above is a minimal trace (turns, usage, stop_reason, cost); a real agent run gives you the full tool-call sequence. When an agent does the wrong thing, you don't guess. You read the trace and find the exact step where a tool got a bad argument or a result was misread. Recovery-strategy selection follows from the diagnosis: retry a transient failure, fix a prompt for a bad extraction, correct a schema for a malformed tool call, escalate what the agent genuinely can't resolve.

## Final thoughts

Claude Code is components with defined places: **CLAUDE.md** and **Rules** for instructions, **Skills** and **Commands** and **Agents** for behavior, `settings.json` on a precedence chain. You run them in modes you pick by task: interactive, **headless** for CI (`--output-format json` returns `is_error`, `stop_reason`, cost, and usage), streaming, auto, and plan. And debugging is triage: **is the failure in your integration (an exception, your bug), the model (a 200 with wrong content, a prompt fix), or the infrastructure (a 429/529, a retry)?** Ask "did the call succeed?" first, read the trace, and pick the recovery that matches the category. Naming *where* a failure lives is most of fixing it. That completes the domains.

Next: [the capstone](/blog/ccd-foundations/21-capstone) — one production bookshop assistant, built across the whole blueprint, with the exam's sample questions worked.
Comments